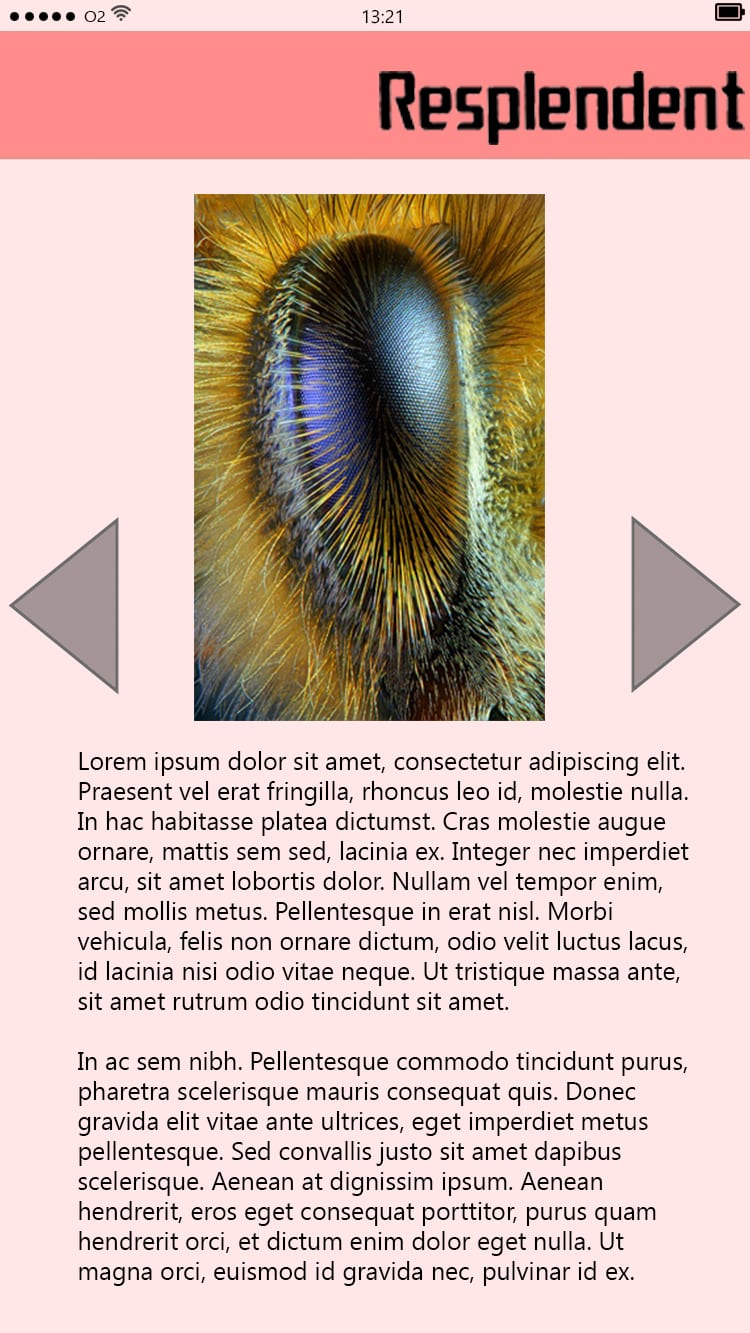
I decided that for my own piece I would create something similar to the New Scientist app, and so I decided that rather than having issues, I would just have separate pages for each type of animal. And so I created a few designs of how I would like the pages to look. Below are the three pages that I designed. 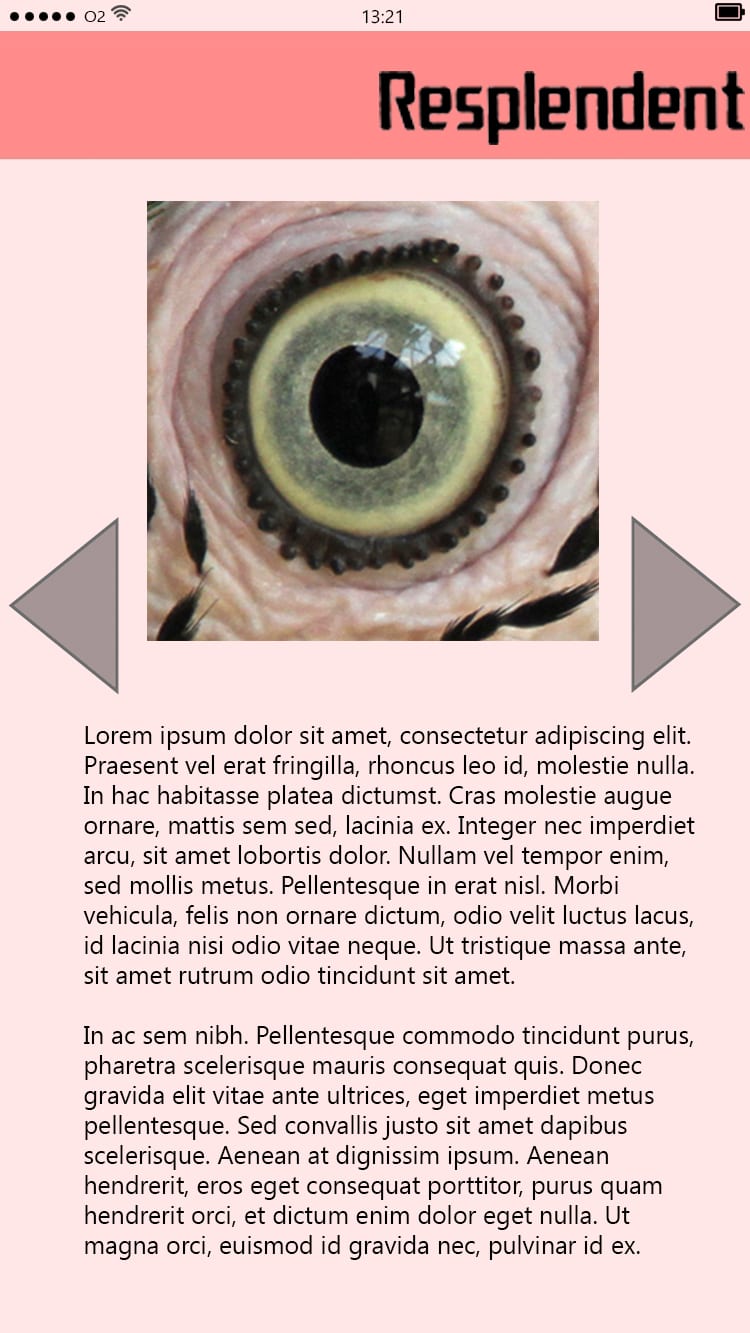
Category Archives: MFDV
Apps
I then looked at desktop vs. apps. Here I looked at the website New Scientist. Instead of comparing the desktop site with the mobile one, I had a look at the app instead. And unlike with desktop vs. mobile sites, the app is usually completely different. In this instance, the website houses a lot of information about the company and what it does, whereas the app dives straight into the subscription where you can read the online magazines. I have found it really useful to look at the differences between the websites and apps design. 

Desktop vs. Mobile
I had a look at different websites, both on desktop and mobile devices, I also looked at websites that had their own apps so that I could compare the effectiveness of the mobile layout. One website that I looked as is called Nautilus. Below as screenshots of the website loaded on a desktop and on a mobile device. It is clear that the website has not been specifically designed to be mobile friendly. However this is just one example and there were many others that had a stronger mobile layout. But I found it interesting to look at the differences between the desktop site and the mobile one.
one.
![]()

Animals and their eyesight.
Planning for my infographic, I decided to look into existing ones that focus on the eyesight of various animals. I found a useful selection on a website called Science Llama. Not only did I find some of the information to be quite useful, but it also gave me an insight as to how I should layout my own infographic. I have found that the display in which they present their information to be appealing and effective and so it is a brilliant starting point for planning my own infographic.
Infrographic
For my info-graphic I have drawn relevant animals to give an image of exactly what animal I am talking about, however, I am also including an image of the animals eyes, and for this I am going to use graphics created with the use photographs, in adobe Illustrator, so that I have an accurate representation of the differences not only in the functioning of their eyes, but of the appearance of them too. Below are the links to the sources for the photographs that I used to create my graphic images;